How to Calculate the Correlation Coefficient On TI 84 Calculator
The TI 84 calculator Online is an effective tool for students engaged in data calculation. A remarkable feature is the ability is being an correlation coefficient graphing calculator, which reflects the strength of the linear association between the two variables. Proper execution of this calculation on a TI-84 can increase productivity and reduce errors when handling data in mathematics, figures, or research.
This training will guide you through procedures for calculating correlation coefficients on TI 84 Calculator, clarifying their importance, and providing an example to show the process.
What is Coefficient in Math?
n math, a coefficient is the number that multiplies a variable in an expression or equation.
For example, in the term 5x, the number 5 is the coefficient — it tells you how many times x is being multiplied.
Here are a few quick examples:
Simply put, the coefficient shows the “weight” or “strength” of a variable in a math expression.
In empirical data, the R value usually varies from -1 to +1.
What is the Correlation Coefficient?
The correlation coefficient, denoted as R, determines the strength and direction of the linear relationship between the two variables. You can calculator correlation coefficient on TI 84 calculator.
Step 1: Enable Diagnostic Mode
Before calculating correlation coefficients, it is necessary to activate the clinical function to enable the TI-84 to display r to give accurate values and works as correlation coefficient graph calculator.
This phase guarantees the inclusion of correlation coefficients in your regression results.
Step 2: Enter Data into Lists to find Correlation Coefficient on TI 84 Calculator
Suppose you will find the correlation coefficient for this data set:
X (Hours Studied) | Y (Test Score) |
|---|---|
1 | 50 |
2 | 65 |
3 | 70 |
4 | 85 |
5 | 95 |
To enter the data in TI 84 or TI 84 Plus CE graphing calculator:
Step 3: Run & Calculate Linear Regression
Now it’s time to calculate the regression equation and the correlation coefficient on TI 84 calculator.
The TI-84 will display:
Step 4: Interpret the Result
Here’s the text we’re looking at: In our dataset, the TI-84 might show the following:
This tells us:
Illustrative Problem
Imagine a student trying to determine the connection between the amount of exercise they do each week and their exam results. Here’s the data they have:
Exercise Duration (hours): 2, 4, 6, 8, 10
Scores: 65, 70, 78, 85, 92

Steps to follow:
Result: r ≈ 0.997.
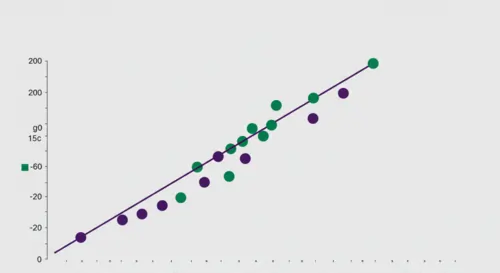
This indicates a strong positive correlation—more exercise appears to be associated with better scores.
Why Use the TI-84 for Correlation?
Conclusion
Learning to calculate the correlation coefficient on TI 84 calculator is a crucial skill for students entering algebra, statistics, and research. By turning on DiagnosticOn, entering data correctly, and using LinReg(ax+b), you can quickly find out how strong the relationship is between two variables.
This feature saves time, allowing you to focus more on analyzing results rather than manually crunching numbers. The TI-84 makes correlation analysis easier and more effective for test scores, business data, and scientific research.